|
The Playbook That Hasn’t Changed in 50 Years
Oil shocks follow a pattern so consistent it’s almost boring. First, the spike. Headlines scream about supply disruption. Crude surges. Markets sell off as investors price in the worst case. Then the bottoming process — choppy, uncertain, dominated by fear. Finally, the recovery, once supply adjusts and prices stabilize.
This pattern has played out in 1973, 1990, 2003, 2022, and now 2026. The details differ, but the structure doesn’t.
The 1990 Gulf War is the closest historical analog to today. Iraq invaded Kuwait. Oil doubled overnight. The S&P 500 fell roughly 16% in three months. But the conflict resolved faster than expected, Saudi Arabia boosted production, and the market recovered within six months of hitting bottom — finishing 1991 up 29% from the low. Investors who sold during the panic locked in losses that the market erased within months.
The 2022 Russia-Ukraine shock followed a similar arc. Brent spiked to nearly $124. The S&P 500 dropped about 7% on the oil component alone, then compounded that decline as inflation forced the Fed into the fastest rate hikes in decades. Markets bottomed in October 2022 and recovered roughly a year later. Again, the investors who stayed seated came out ahead.
The 1973 embargo is the cautionary case. That shock persisted for five months, hit an economy far more dependent on foreign oil, and was compounded by policy mistakes. The S&P fell 16% and took six painful years to recover. The difference: duration and structural exposure. In 1973, the U.S. had no domestic production cushion. Today, it’s the world’s largest oil producer.
RBC Capital Markets made the key distinction clearly: the issue is not a short-term oil spike. What matters is whether elevated prices are sustained long enough to reignite inflation and force the Fed’s hand. That’s the fork in the road. A 1990-style resolution — quick diplomatic outcome or forced reopening of Hormuz — means a sharp recovery. A 1973-style prolonged closure means deeper damage.
Right now, the S&P 500 is down about 7% from its January high and has logged four straight weekly losses. That’s squarely within the average range for geopolitical oil shocks.
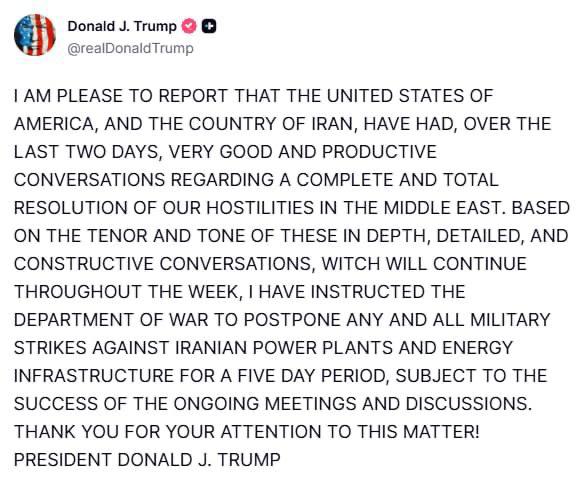
And then, this morning, the pattern showed its hand again. Trump posted that the U.S. and Iran held “productive conversations” over the weekend and announced a five-day pause on strikes against Iranian energy infrastructure. Oil cratered 8% within minutes — Brent fell from above $113 to roughly $104, WTI dropped to $90. U.S. futures surged.
|
But Iran has not confirmed any talks. Iranian state TV claimed Trump “backed down out of fear.” The Strait remains closed. Strikes continue elsewhere in the region. This is exactly the kind of choppy, headline-driven volatility that defines the bottoming phase of every oil shock. The 1990 Gulf War had multiple false-start diplomatic signals before resolution. So did 2022.
The IEA has released a record 400 million barrels from strategic reserves. Saudi Arabia is rerouting through Red Sea pipelines. The UAE is pushing oil through its Abu Dhabi pipeline. These are the same kinds of supply offsets that shortened the 1990 and 2022 shocks. Whether they work this time depends on one variable: how long Hormuz stays closed.
For long-term investors, the data points to a clear conclusion. Every geopolitical oil shock since WWII has been temporary. Every one. The S&P 500 has recovered from all of them. The investors who were punished hardest were the ones who sold into the fear and missed the rebound. The question is never whether the market recovers. It’s whether you’re still in when it does.
Today’s $10 oil swing in a single session is not a resolution. It’s the pattern doing what it always does: whipsawing on every headline before the dust settles. Duration of the supply disruption — not any single post on social media — is what separates a dip from a downturn.
|